Work / holding
Receivables risk across a group of companies
Which receivables are at risk, where, and how the risk develops - a Power BI model over regular ERP snapshots, with comments that stay valid only as long as they should.
- Client
- Industrial group, several companies
- Industry
- holding
- Services
- BI, Data
- Stack
- SAP S/4HANA, Power BI, DAX, Tabular Editor
- Period
- ongoing
Context
A group of companies on SAP. Finance had the data, but answering “how much is overdue, where, and is it getting worse?” meant exports and spreadsheets - and the answer was always a snapshot of one day.
What I do
A clean data path. A scheduled job in the ERP fills dedicated reporting tables with the selected data. Power BI reads only those tables, through a read-only technical user. Nobody reports straight from the ERP’s own tables, and the ERP team decides what leaves the system.
History from snapshots. Each run is kept as a snapshot, so the model shows not only today’s overdue amounts but how risk develops over weeks and months - per company, per customer.
Comments that expire. Finance can comment on a receivable - “payment agreed for the 15th”, “in dispute”. Each comment carries a validity period, and the model shows the comment valid for the date you are looking at. Old explanations don’t hang around after they stop being true.
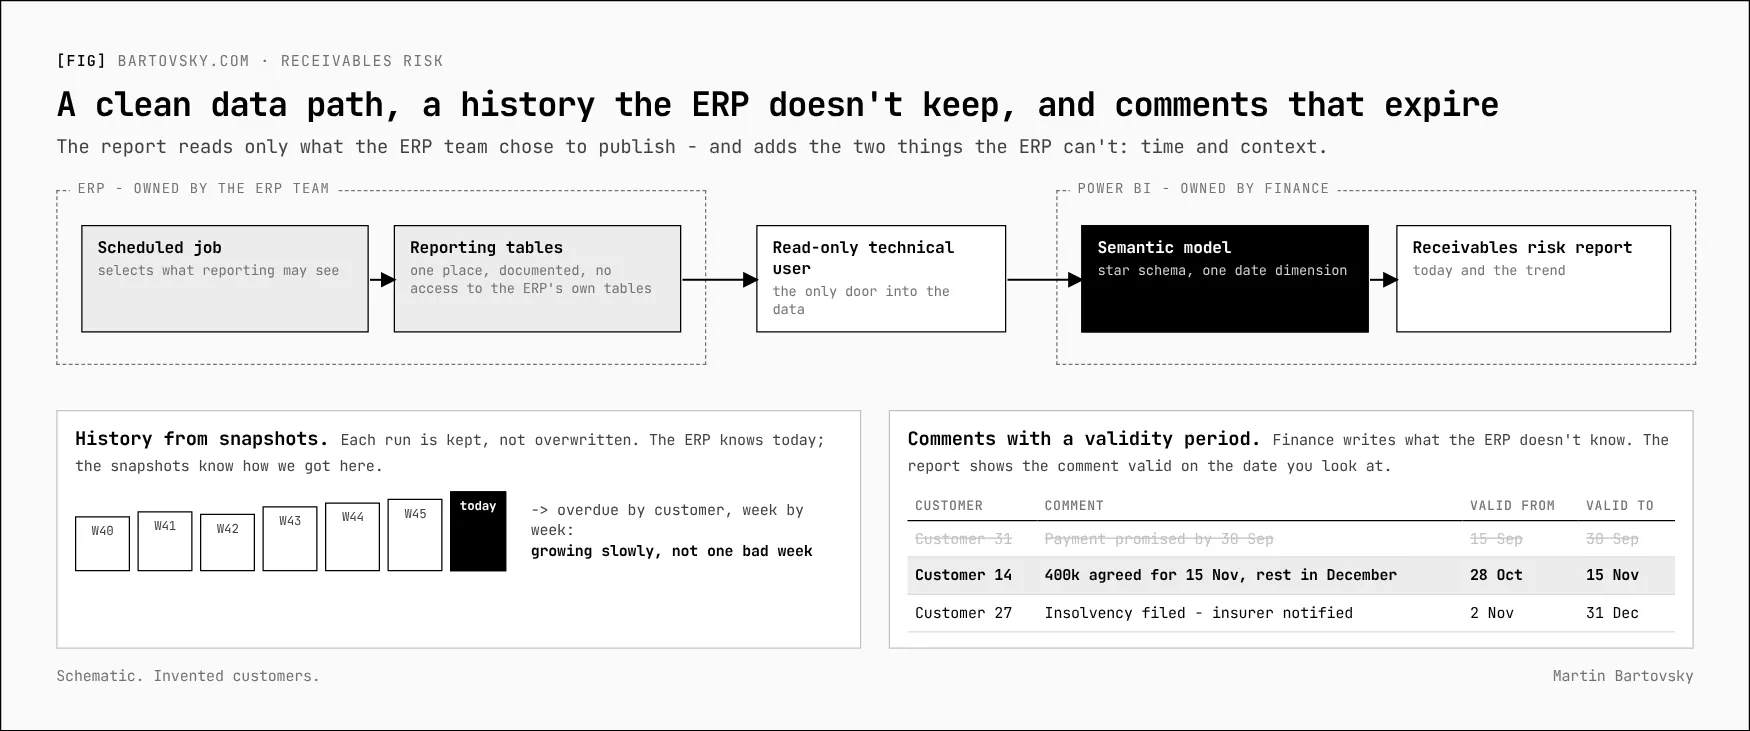
A model built to be maintained. Star schema, one date dimension, measures in a predictable structure; bulk changes scripted rather than clicked.
Licensing and governance. With several thousand potential report viewers, I worked out at what point capacity licensing beats per-user licences - and flagged that a small internal team building reports for a whole group is a bigger risk than the licence model.
Why it matters
A receivables report is only useful if finance trusts it enough to act on it. That trust comes from the data path and the history, not from the visuals.
[->] next step
Where do your numbers stop adding up?
Start with a short call. Bring one report nobody trusts - I'll trace it back to where the data gets captured.