[00] independent erp & bi consultant
Numbers you can trust, from the warehouse to the board report.
ERP, BI and AI for companies that make, stock and sell goods - and whose data doesn't add up yet. I fix how data gets captured, build the reporting on top, and turn it into decisions: why a number changed, and what to do about it.
$ whoami martin bartovsky · paris area · erp & bi, both sides of the table
- 01reportgross margin, Q3, all stores38.2%?
- 02modelmargin = sales - cost of goodsok✓
- 03erpSKUs with cost price = 01,240x
- 04sourcegoods received without a priceroot!
- 05fixprice required at receipt + nightly checkdone✓
- 01reportassembly stopped, part K-14 missing0 pcs?
- 02erporder line: delivery on 12 Octopen✓
- 03mailsupplier moved it to 26 Octinboxx
- 04sourcedate change never reached the ERProot!
- 05fixone route for every date + 5-day checkdone✓
- 01reportEBIT year to date vs budget-1.3M?
- 02salesrevenue above budget+2.2%✓
- 03costmaterial share 44.1% vs 41.5% planned-1.2Mx
- 04sourcesteel surcharge not passed onroot!
- 05actsurcharge clause with 2 key customersowner✓
[01] services
Three things, done properly.
For companies that make, stock and sell goods - manufacturers, retailers, e-shops.
- ERP
ERP projects
Implementation, migration and consolidation - translating between the business and its suppliers, and asking the awkward questions on both sides.
- +Process maps in BPMN - where handovers break
- +Roles, permissions and master data
- +Migration supervision
- BI
BI & AI
Power BI and Microsoft Fabric models on SAP, SQL Server and Oracle data - with AI on top where it saves real hours.
- +Semantic models built for decisions
- +Plain-language questions to the data
- +Cloud or local models, where data shouldn't leave the company
- DEC
Analysis & decision support
From a number to a decision: why it changed, where in the process it started, what follows - and who acts on it.
- +Cause and effect, down to the process
- +Trends from snapshots, not just today
- +Read-outs with one action and an owner
[02] approach
Capture. Model. Analyse. Decide. In that order.
A report is not the end of the job. A dashboard on top of bad capture shows the wrong number faster - and a right number nobody acts on changes nothing.
- 01CAPTURE
CAPTURE
Fix how data gets captured
Map the process first - who does what, where work is handed over. Then master data, booking rules, who may change what.
erp receipt = qty + price
- 02MODEL
MODEL
Model it once, for decisions
One semantic model on the dimensions the business decides by.
model sales · stock · margin
- 03ANALYSE
ANALYSE
Find the cause, not a culprit
Compare over time, split the change, follow it back into the process - with AI where it saves real hours.
why -8% = price + volume + mix
- 04DECIDETRUST ✓
DECIDE
Turn it into a decision
A read-out with one action and an owner, checked against the next snapshot.
act owner · date · next check
- TRUST ✓
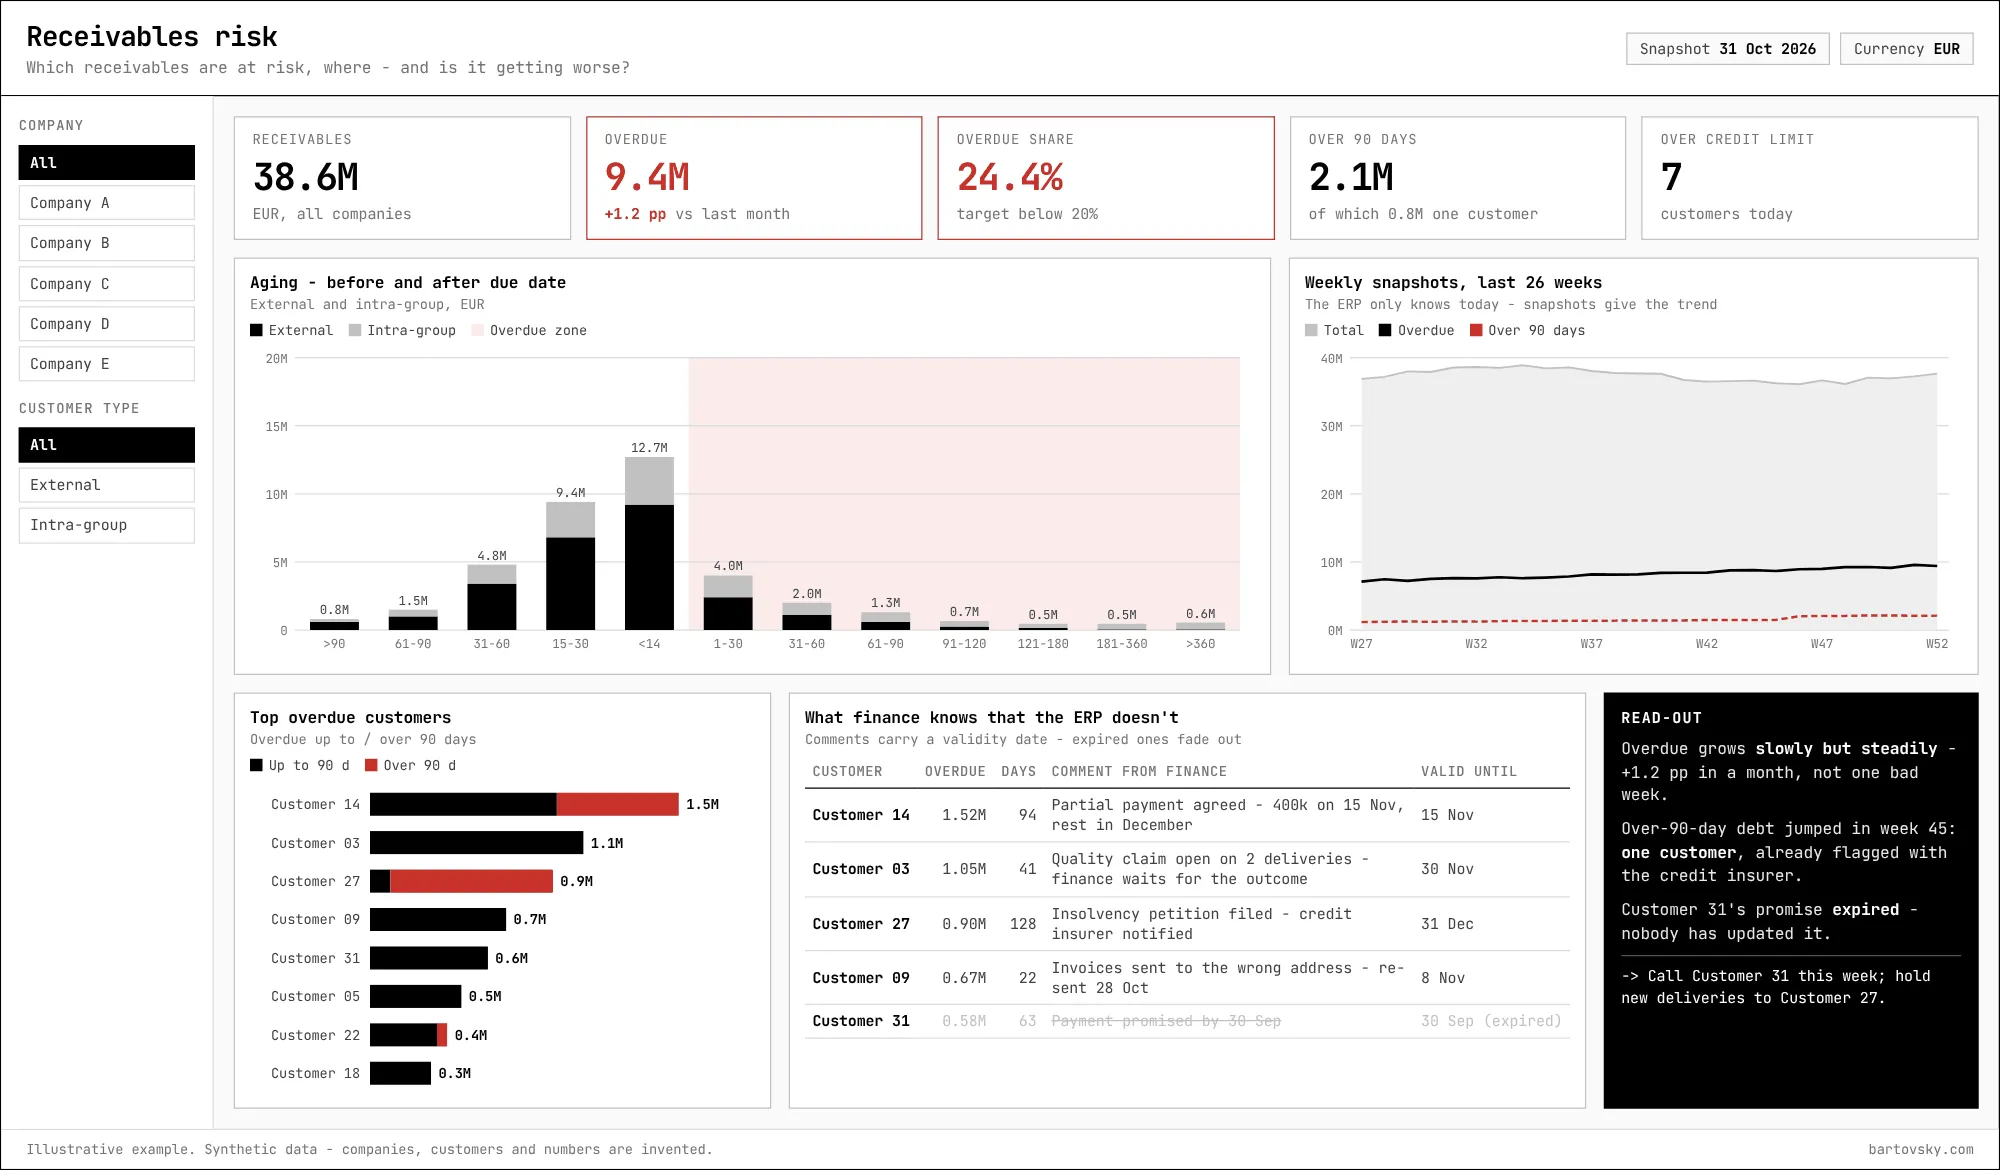
Every page answers one question and ends with a read-out: what changed, why, and what to do. Eight examples ->
[03] point of view
Most reporting problems aren't reporting problems.
They start where data gets captured. And AI on top of messy data doesn't fix it - it just gets things wrong faster.
| what you see | where it starts |
|---|---|
| Stock that exists only in the system | Goods movements booked late, or not at all |
| Margins nobody believes | Cost prices missing or never maintained |
| E-shop and ERP orders don't match | No shared key, manual re-entry between systems |
| Dashboards nobody opens | Dimensions designed for accounting, not for decisions |
| Reports everyone reads, nobody acts on | No read-out, no owner, no check against the next snapshot |
[04] selected work
Recent projects.
- 01Representative work, synthetic dataRepresentative work, synthetic dataEight dashboards, eight decisions BI · Data
- 02Mid-sized discrete manufacturerMid-sized discrete manufacturerERP migration: the work around the software ERP
- 03Illustrative case - invented manufacturerIllustrative case - invented manufacturerOne route for every delivery date: mapping a purchasing process ERP · Data
[05] stack
The systems your numbers pass through.
- SAPSAP ERPfinance and production data
- SQLSQL Serversource data and views
- ORAOraclesource systems
- HEHelios iNuvioCzech mid-market ERP
- QADQADmanufacturing ERP
- PBIPower BImodels, DAX, reports
- FABMicrosoft Fabriclakehouse and pipelines
- WEBE-shoporders and stock sync
- AILLMscloud or local
- MCPMCPAI connected to data
- XLExcelwhere it usually starts
- +your systemif it stores numbers
[06] about
Between the warehouse and the board report: stock that exists only in the system, margins nobody trusts, dashboards built on dimensions that were wrong from day one. That's where I work.
More about me ->- Based
- Paris area, France
- Role
- ERP, data and decisions - no vendor ties
- Business
- Martin Bartovsky EI, France
- Languages
- English, Czech, Polish (passive) - French in progress
[->] next step
Where do your numbers stop adding up?
Start with a short call. Bring one report nobody trusts - I'll trace it back to where the data gets captured.