Work / demo
Eight dashboards, eight decisions
Representative Power BI dashboards - receivables, liquidity, P&L against budget, production delays, labour hours, stock, margin and machine effectiveness. Each answers one management question and ends with a read-out - what changed, why, and what to do about it. Built from scratch with synthetic data.
- Client
- Representative work, synthetic data
- Industry
- demo
- Services
- BI, Data
- Stack
- Power BI, DAX, Microsoft Fabric
Why these exist
These eight are illustrative examples, built from scratch with synthetic data - the companies, customers, items and numbers are invented. What they show is how I structure a report: the question it answers, the layout, and how a page is read.
A report is not the end of the job. The data becomes useful when someone can say what changed, why it changed, and what happens next - and when that is written down, not only said in a meeting.
How I build them
- One question per page. It’s in the title. If a page needs two questions, it’s two pages.
- Today and the trend. An ERP knows the state of today. Weekly snapshots turn it into a history, so a number can be compared with last week, last month and last year.
- From symptom to cause. A red number is where the analysis starts. The cause is usually in a process: a booking rule, a missing master record, a structure that doesn’t match the shop floor.
- One colour for exceptions. Everything is grey or black; red means late, overdue, blocked or below target. The eye goes where it should.
- Knowledge that isn’t in the ERP. Finance knows that a customer agreed to pay on the 15th. That goes into the report as a comment with a validity date - and fades out when it stops being true.
- A read-out with one action. Three sentences on what the page says, one action with an owner. That’s the difference between information and a decision.
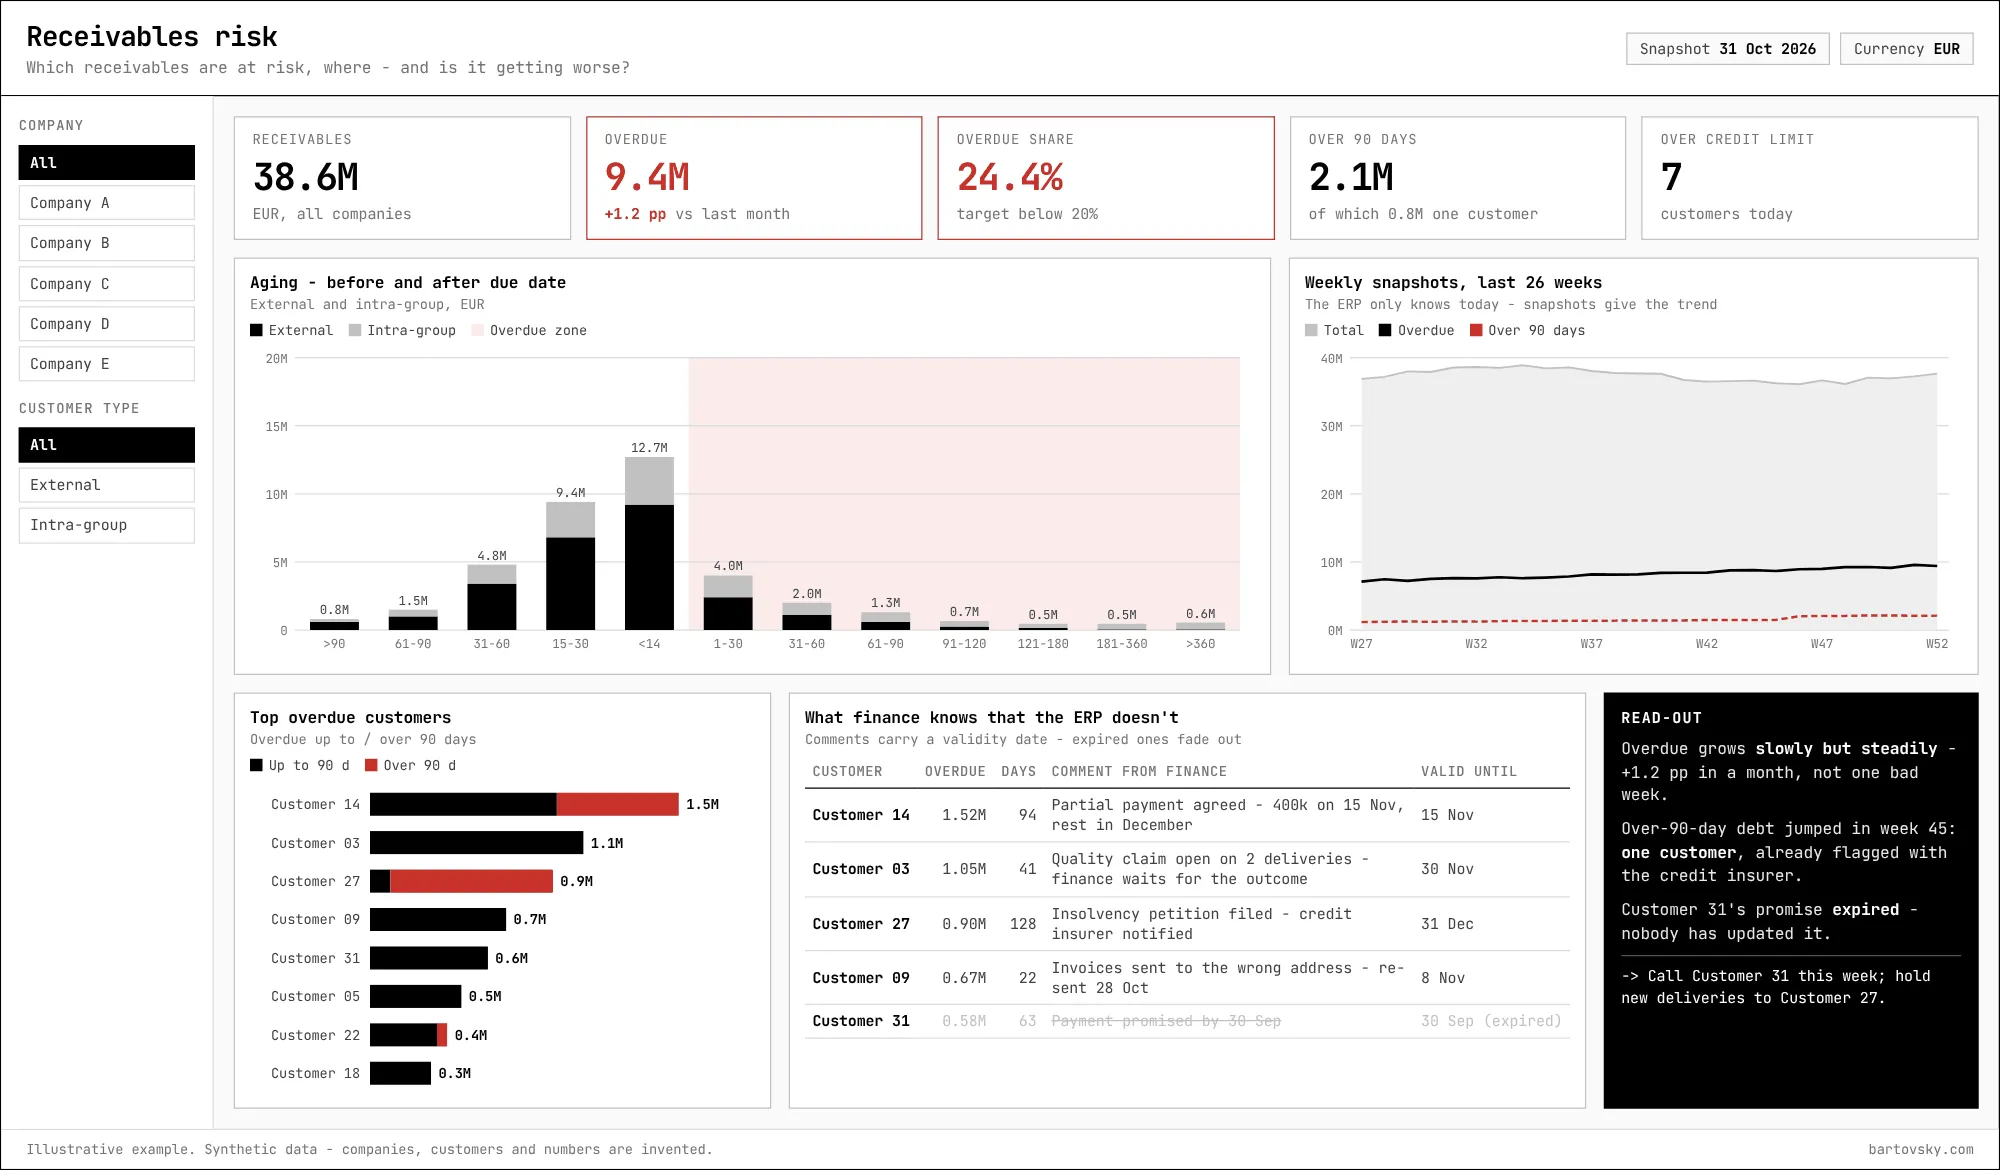
1. Receivables risk
Which receivables are at risk, where - and is it getting worse?
- Aging shows the shape of the risk - before and after the due date, external and intra-group.
- Weekly snapshots show the direction: overdue growing slowly every week is a different problem from one bad week.
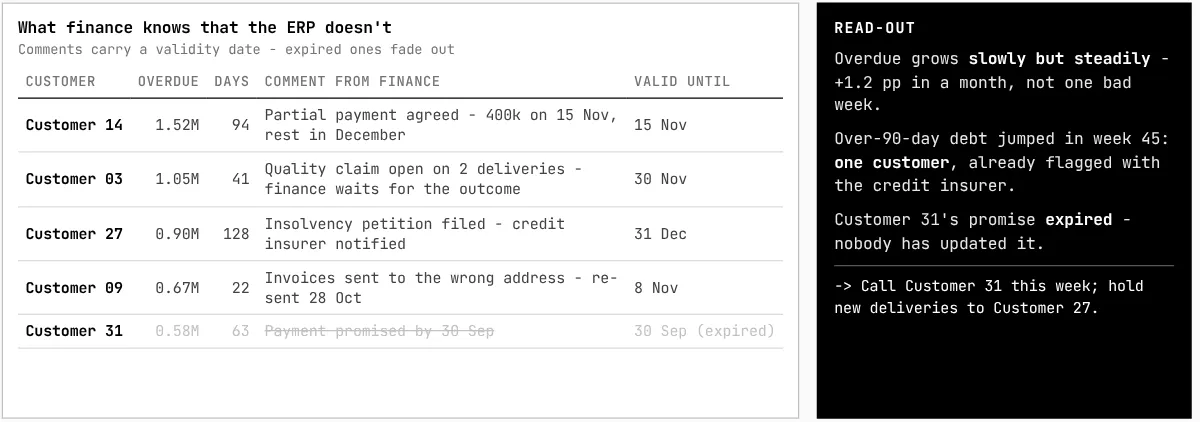
- The comments table carries what finance knows. An expired promise is visible as expired - which is itself a finding.
2. Group liquidity
Can the group pay what is due - and where is the cash tied up?
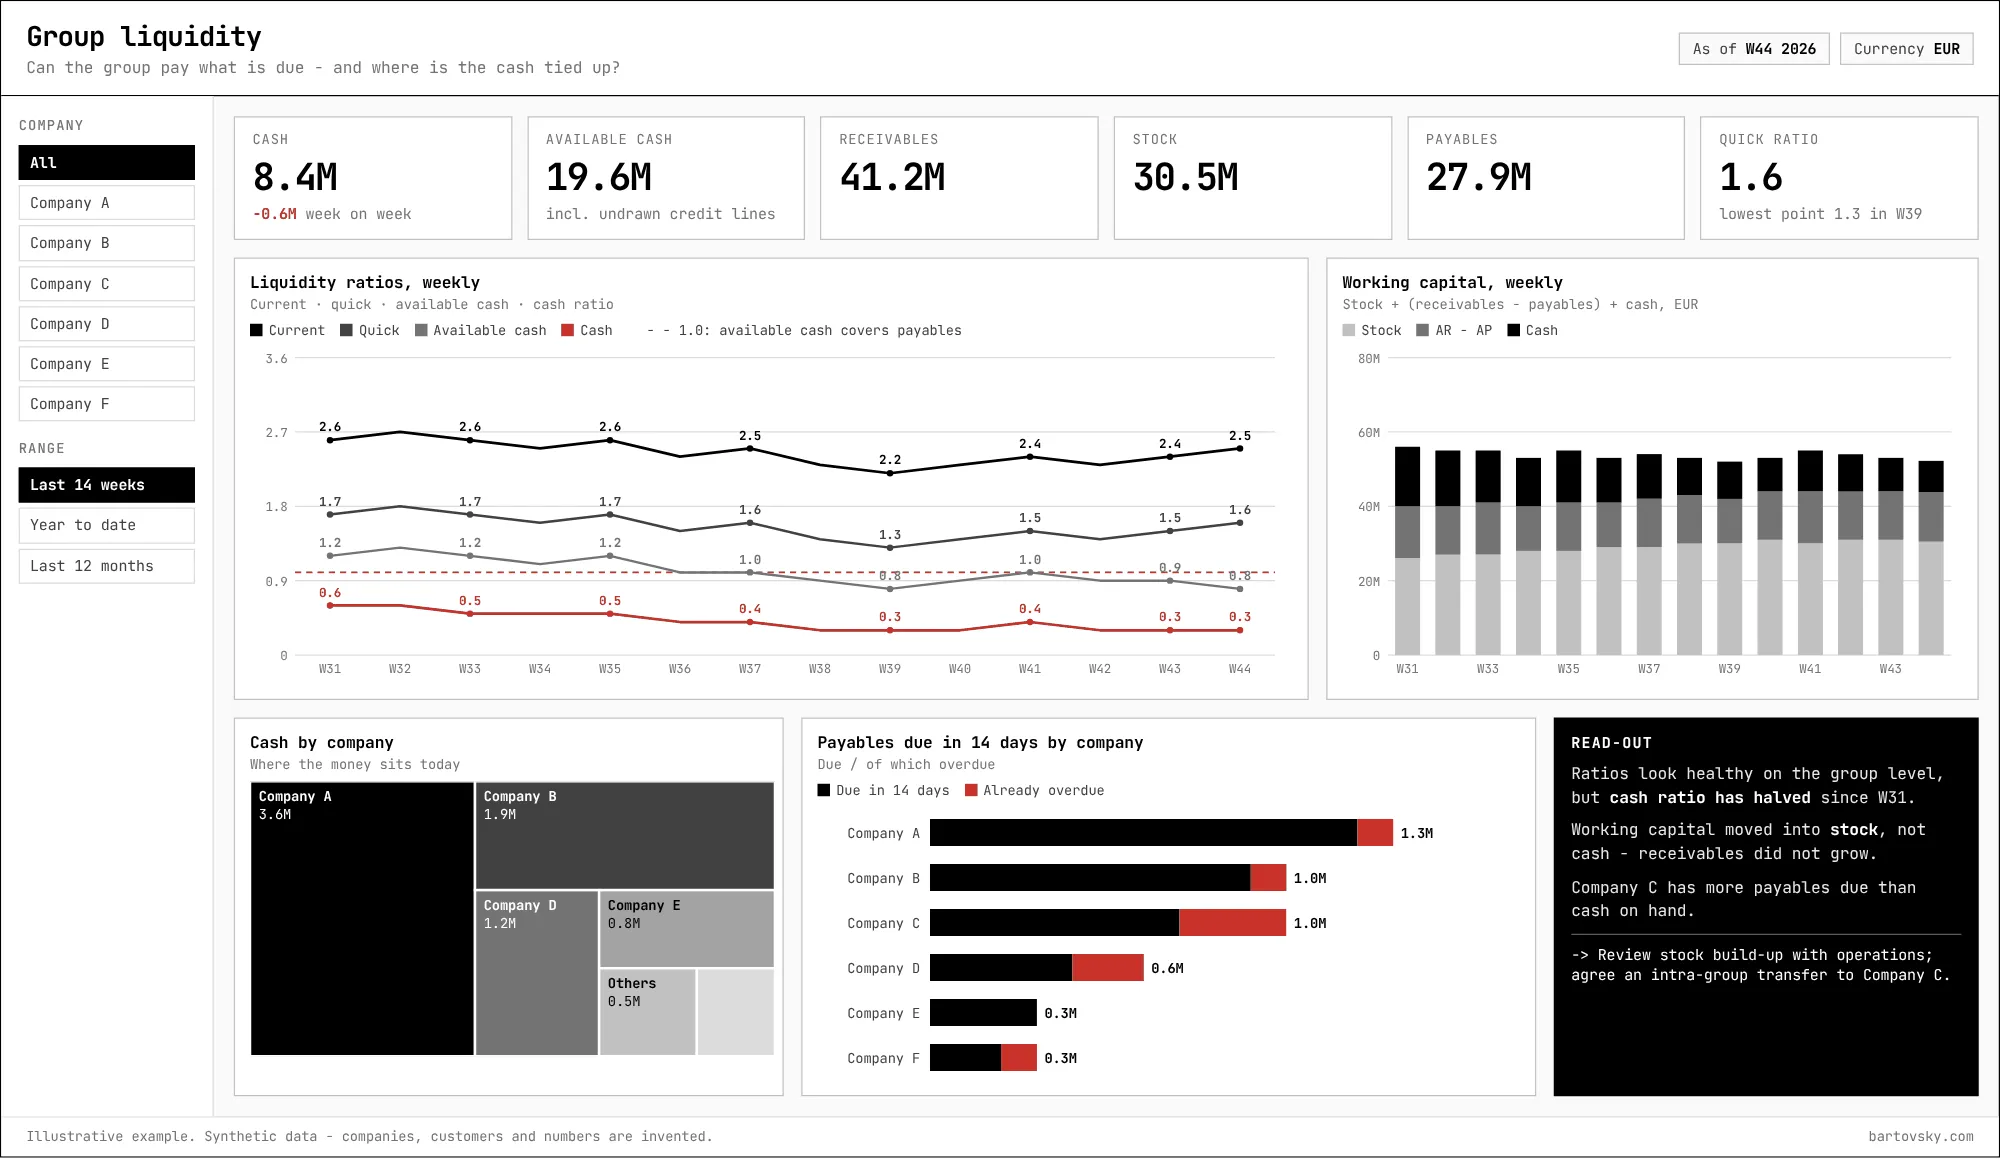
- Four ratios on one axis, weekly. Healthy ratios on the group level can hide one company that can’t pay next week.
- Working capital split into stock, receivables minus payables, and cash shows where the money went - here into stock, not into receivables.
3. Management P&L
Why did EBIT miss the budget - and who has to act?
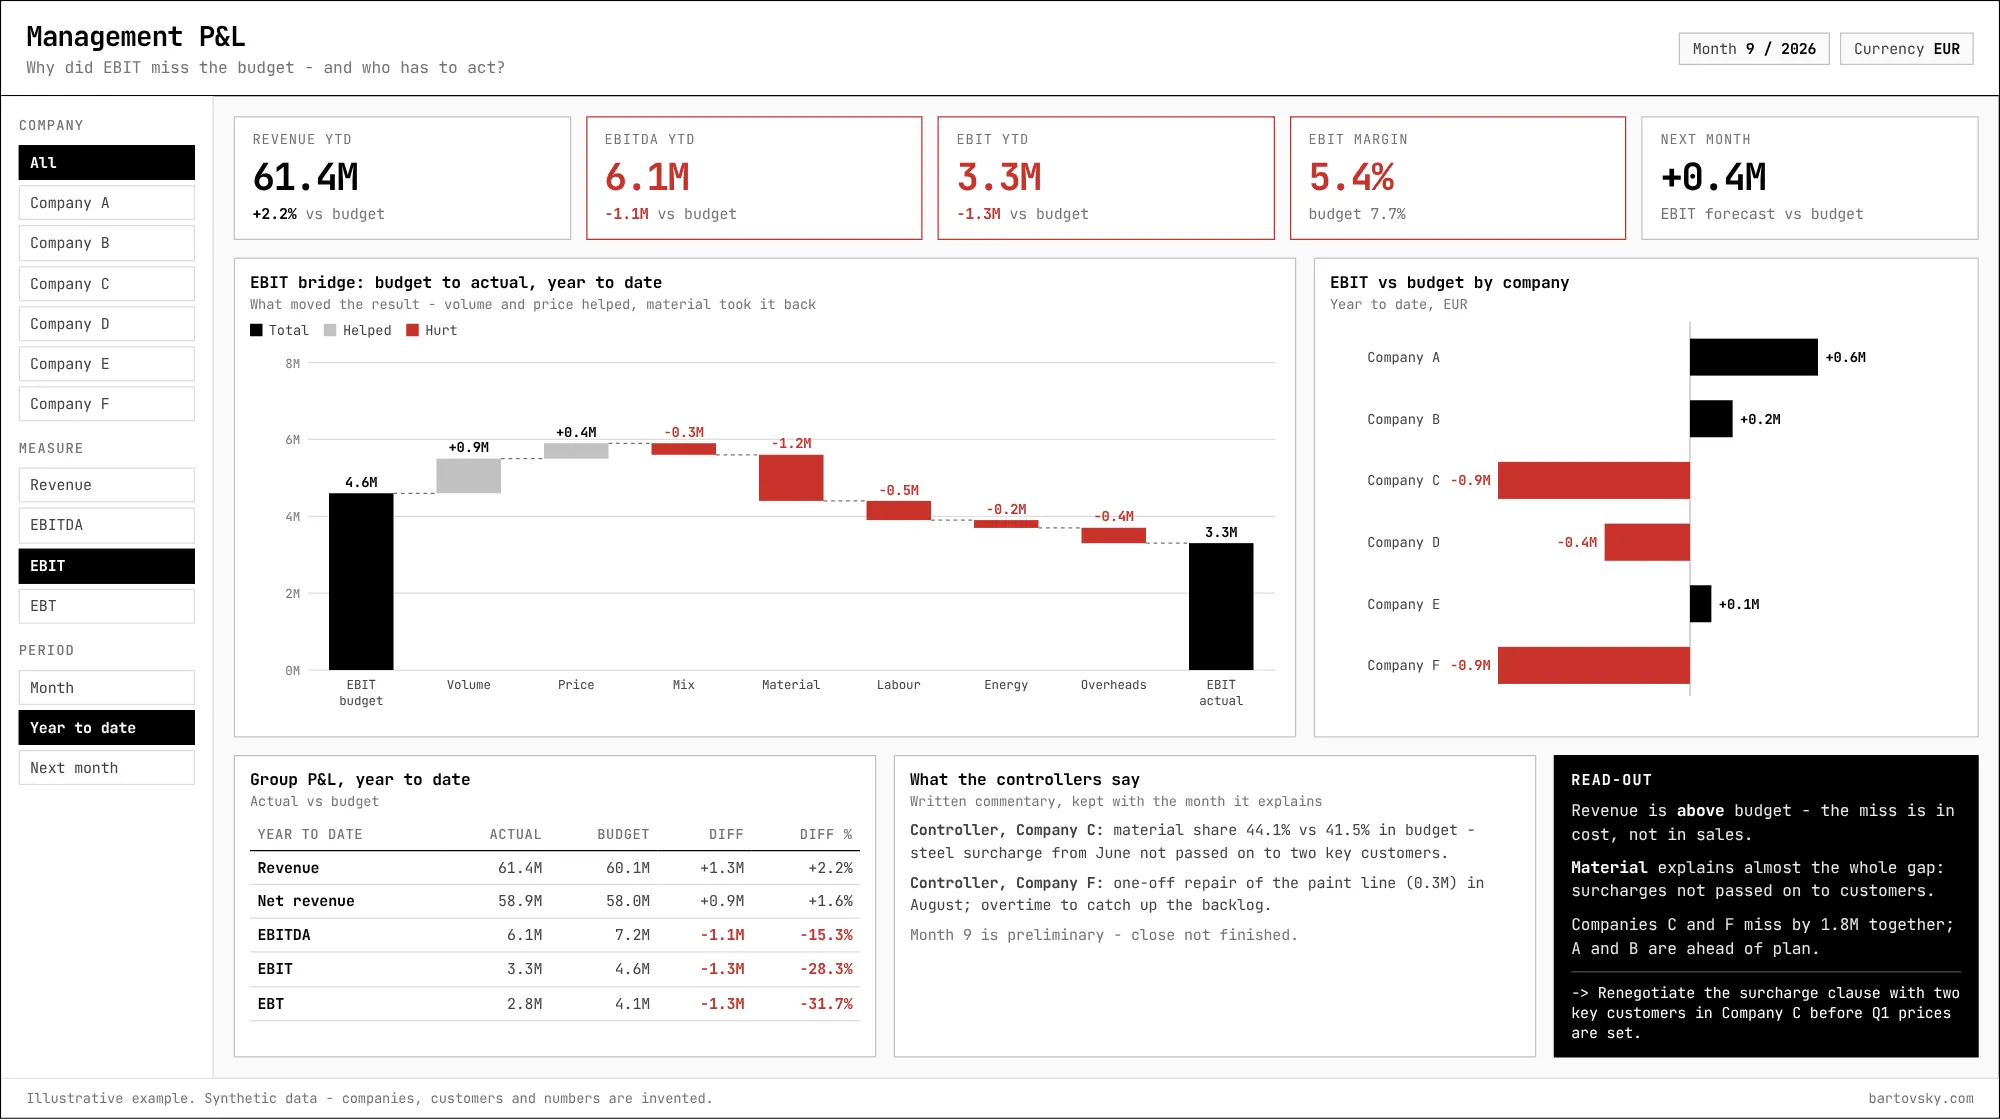
- A variance table says how much. The bridge says why: volume and price helped, material took it back.
- The controllers’ commentary is kept with the month it explains - the knowledge behind the number doesn’t live in someone’s inbox.
4. Production delays
What is late, why - and can the next operation start?
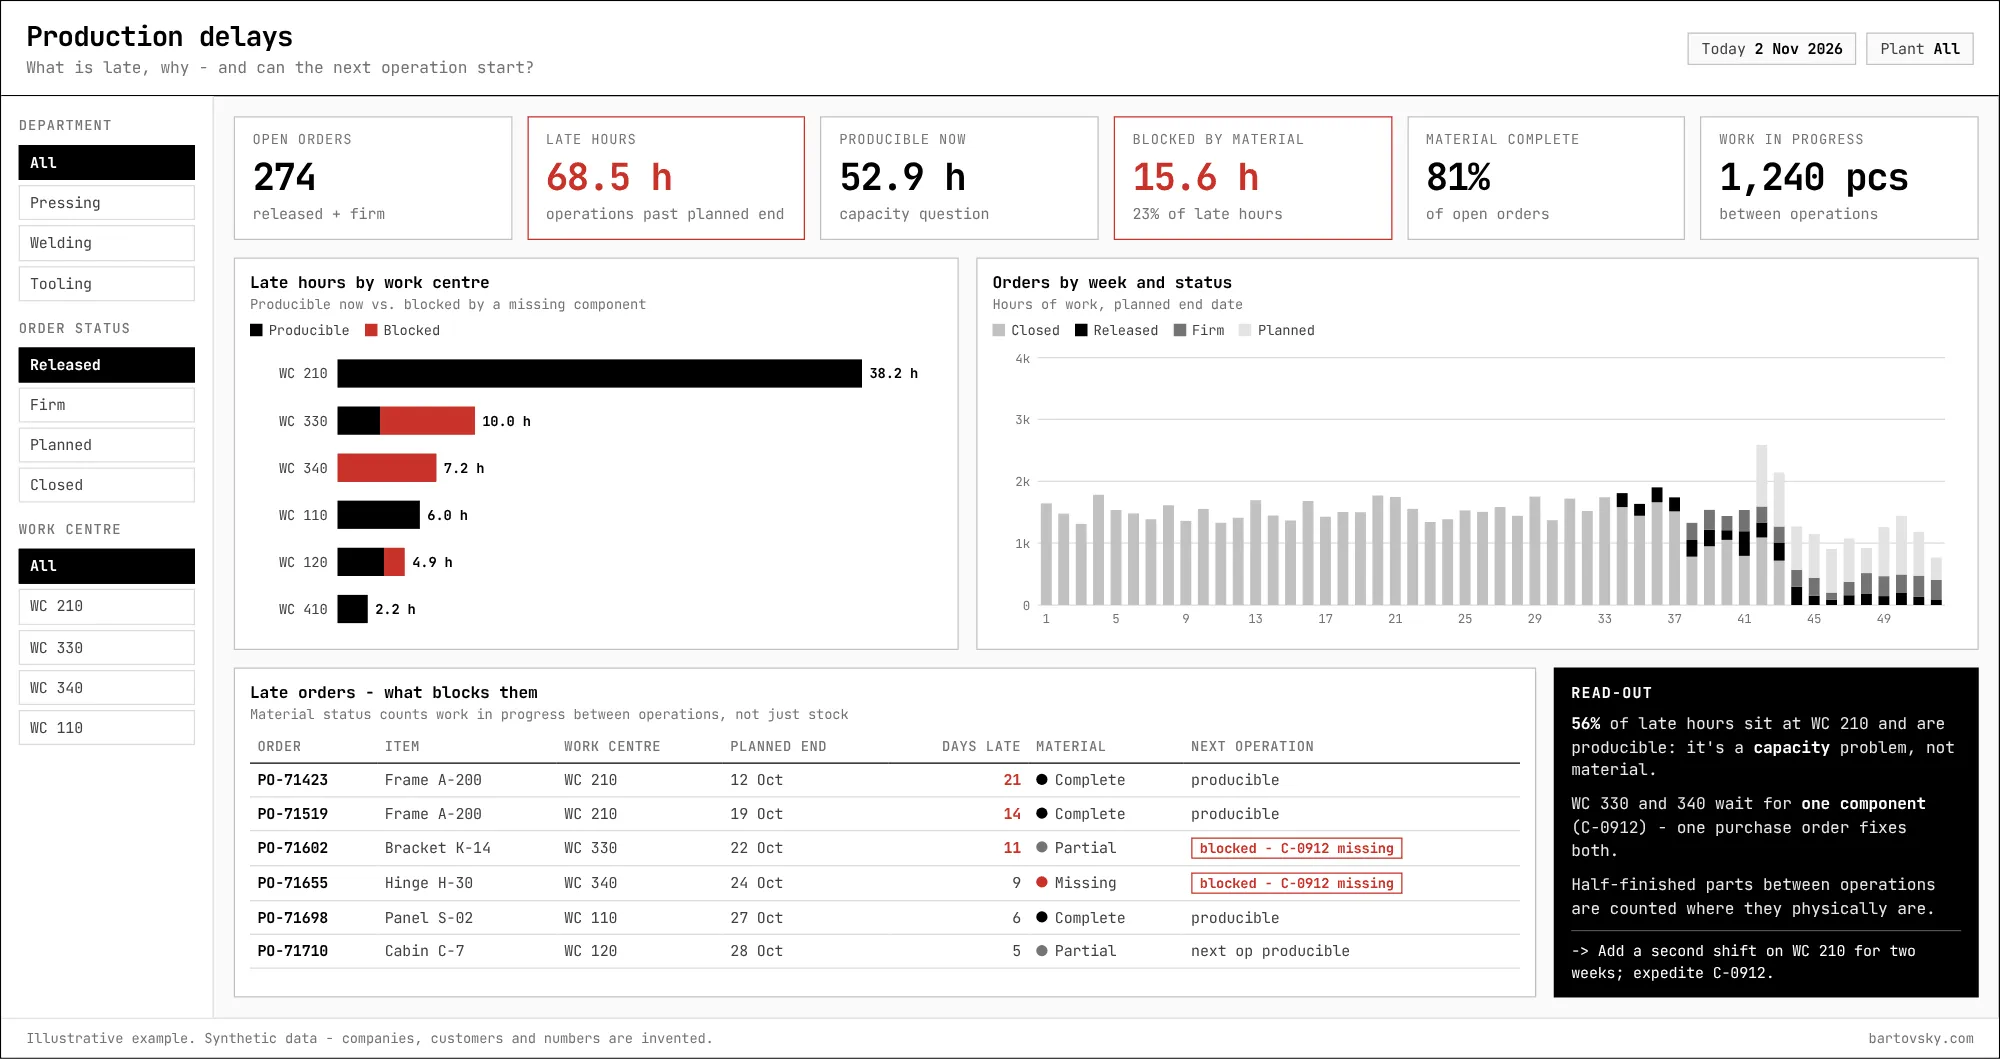
- Late hours split into producible now (a capacity question) and blocked by a missing component (a purchasing question). Different owners, different actions.
- Material status counts half-finished parts between operations where they physically are. Leave them out and the report shows shortages that don’t exist.
5. Labour hours
Are hours booked where they were worked - and are the standards still right?
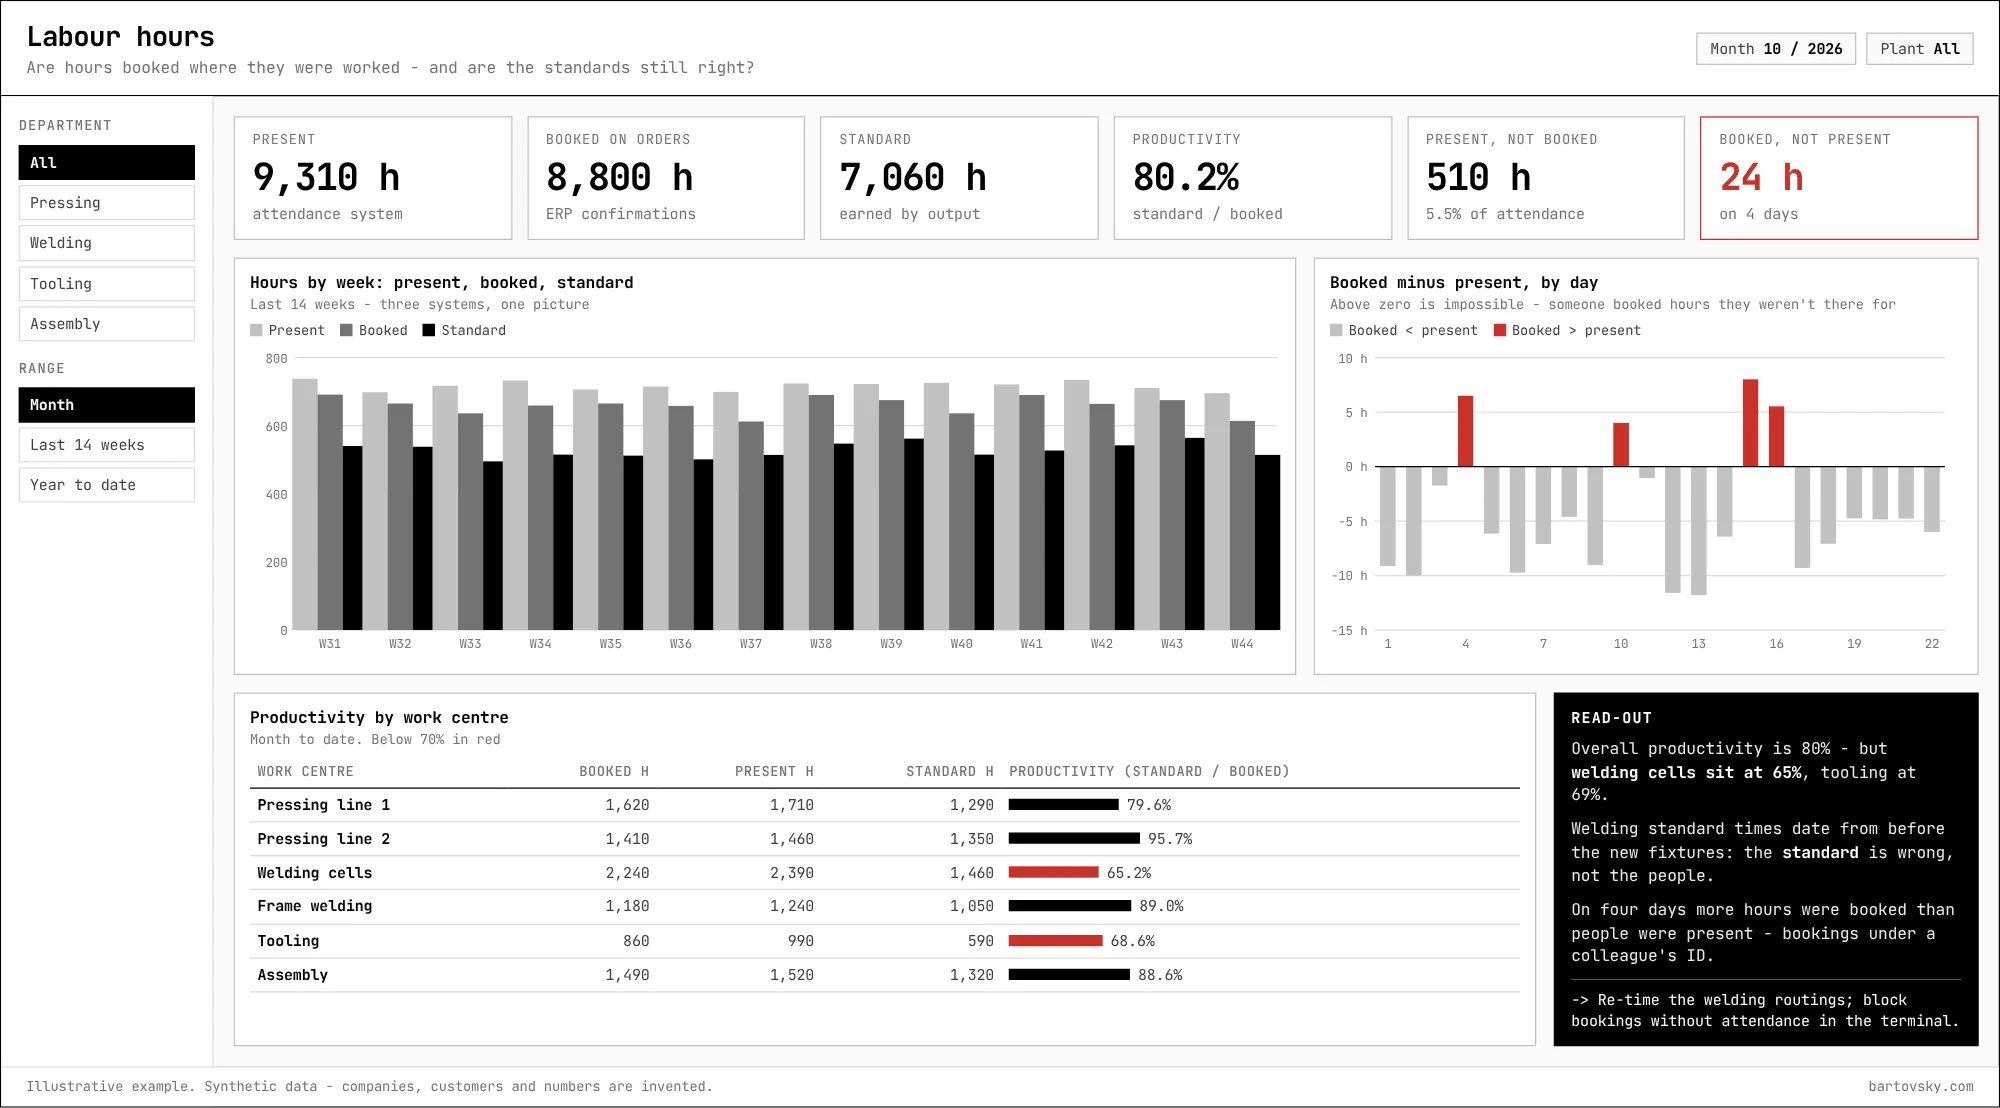
- Three systems in one picture: attendance, confirmations in the ERP, and standard hours earned by output.
- Hours booked by people who weren’t present are a capture problem. Low productivity on one work centre is often a standards problem - a routing nobody re-timed after the process changed.
6. Stock and turnover
What is in stock, how fast it moves - and what shouldn’t be there at all?
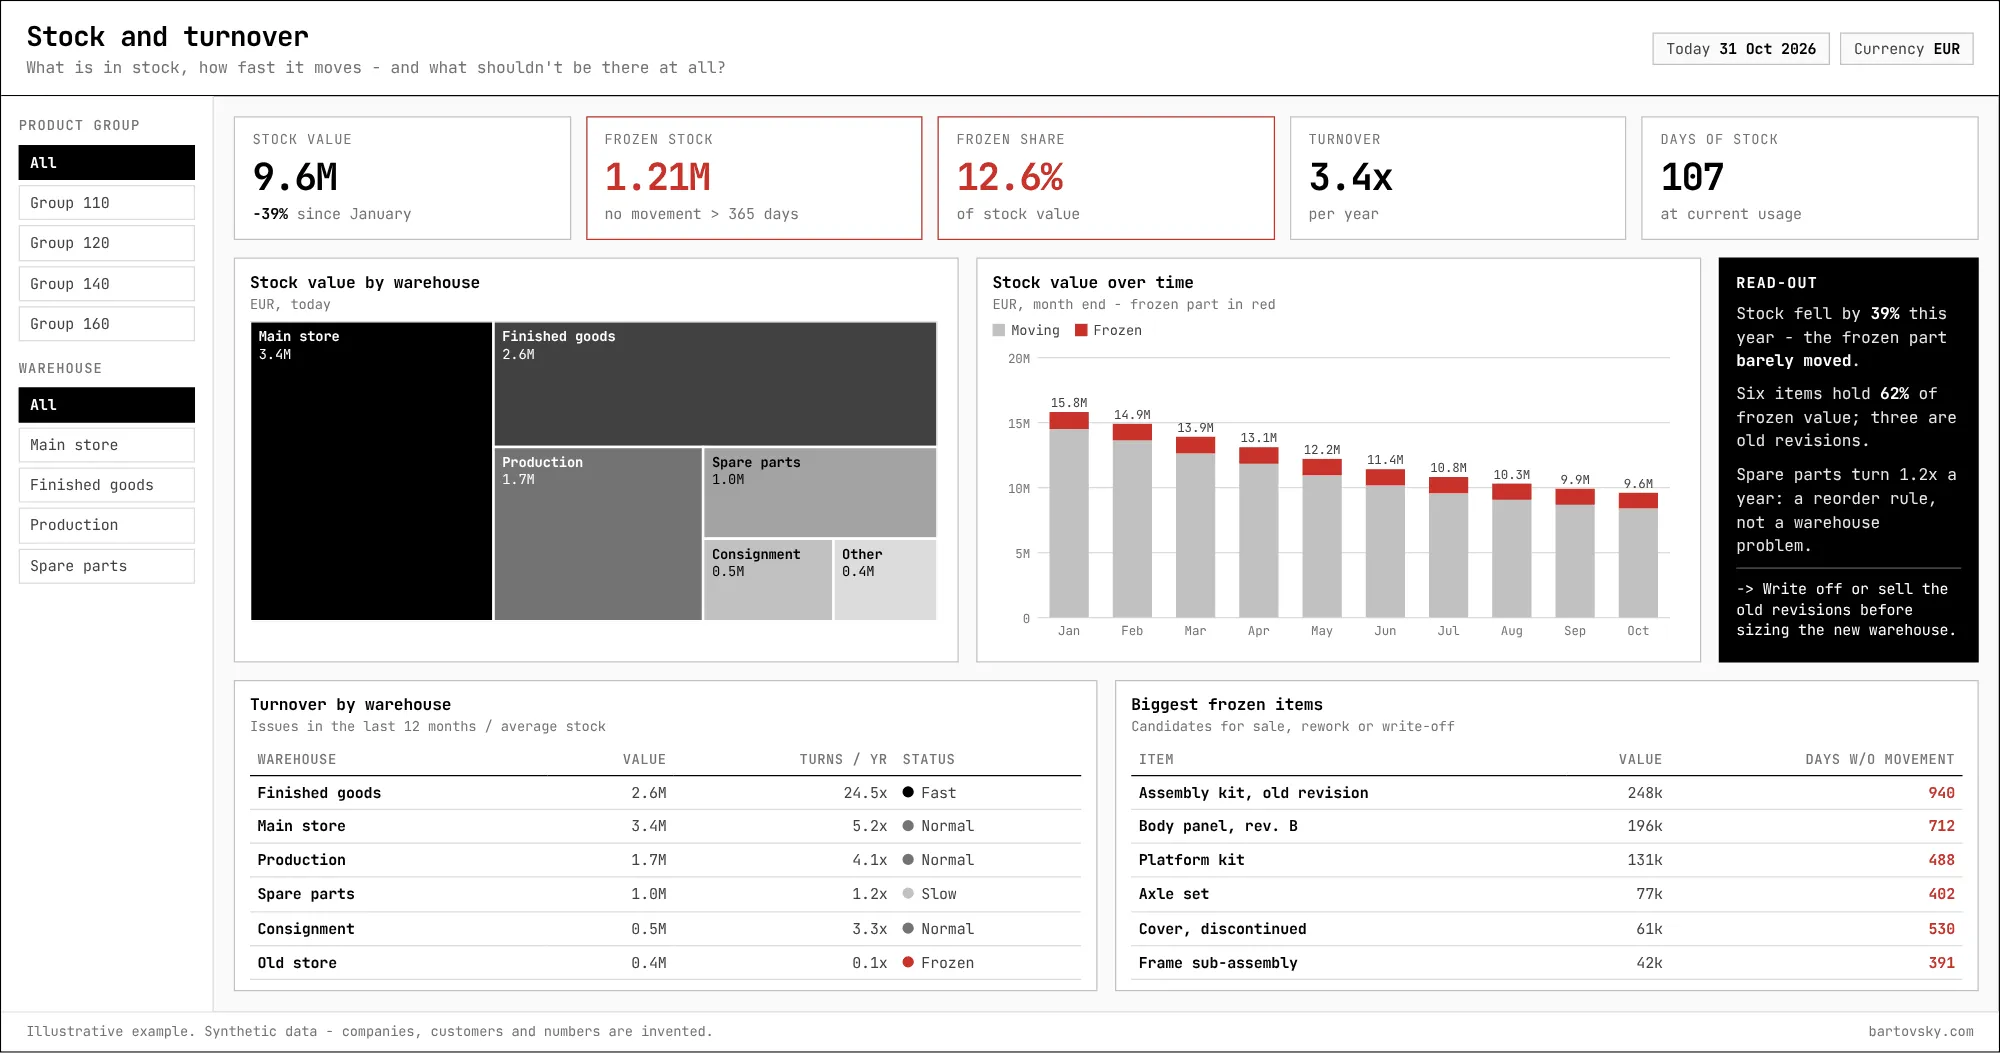
- Total stock can fall while the frozen part - no movement for a year - stays where it was. Both need to be on the same chart to see it.
- The frozen-items list is the work list: sell, rework or write off. Before sizing a new warehouse, not after.
7. Margin and product mix
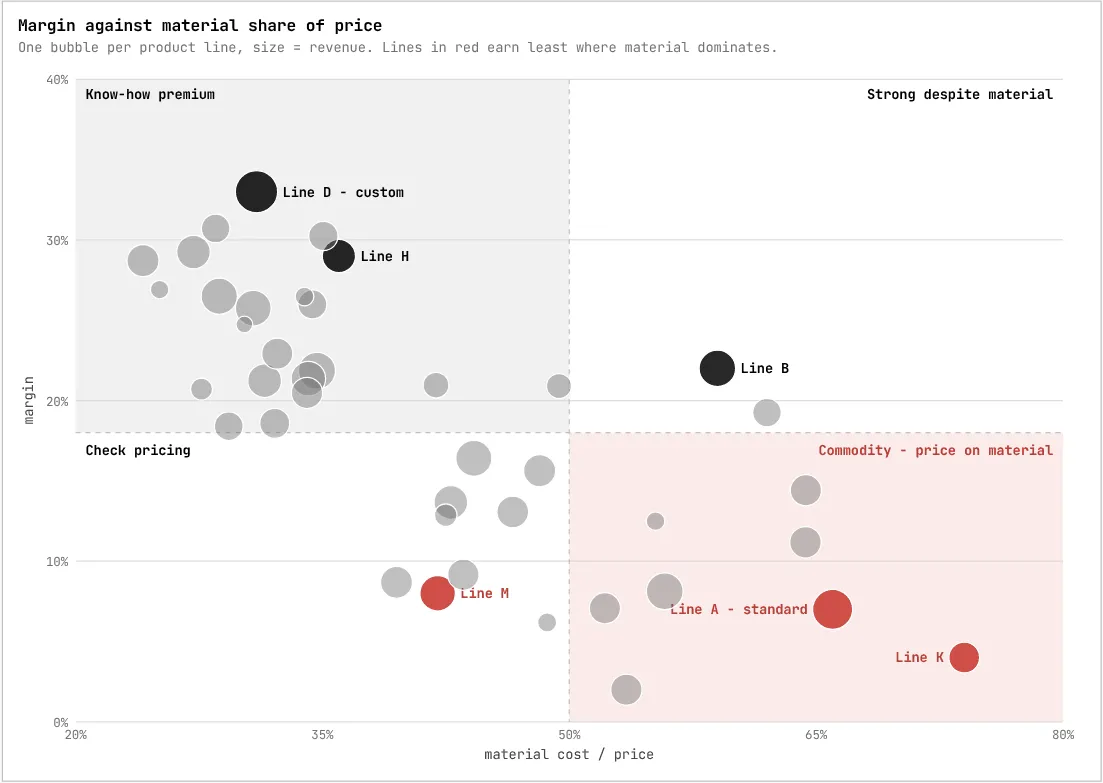
Where do we earn - and where does material eat the margin?
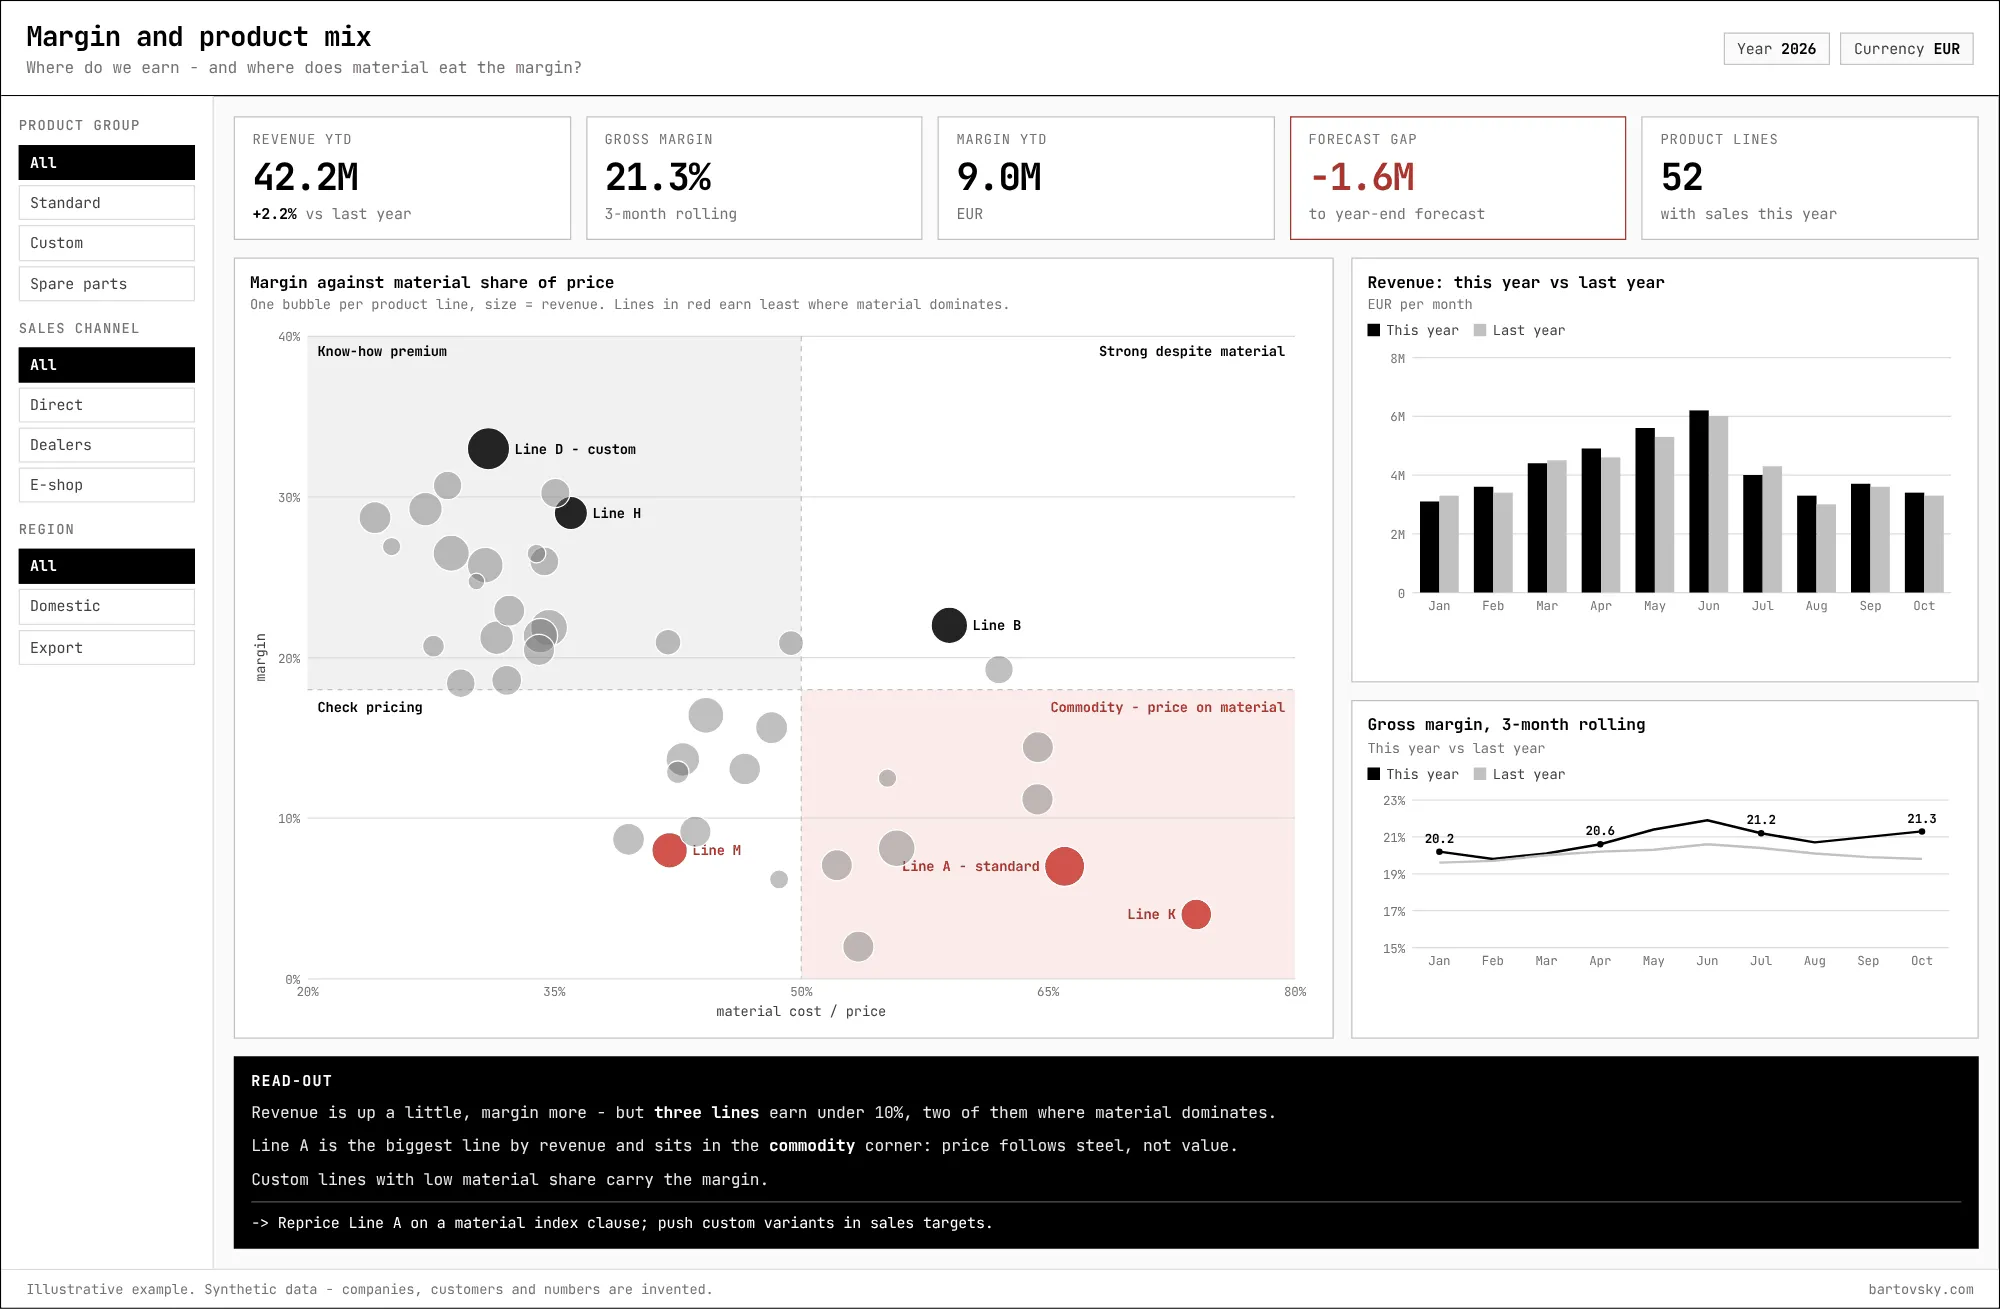
- One bubble per product line: margin against the share of material in the price. The quadrants say what kind of problem it is - pricing, commodity, or none.
- The biggest line sitting in the commodity corner is a pricing conversation (a material index clause), not a production one.
8. Machine effectiveness (OEE)
Where does production time go - and which loss is worth fixing first?
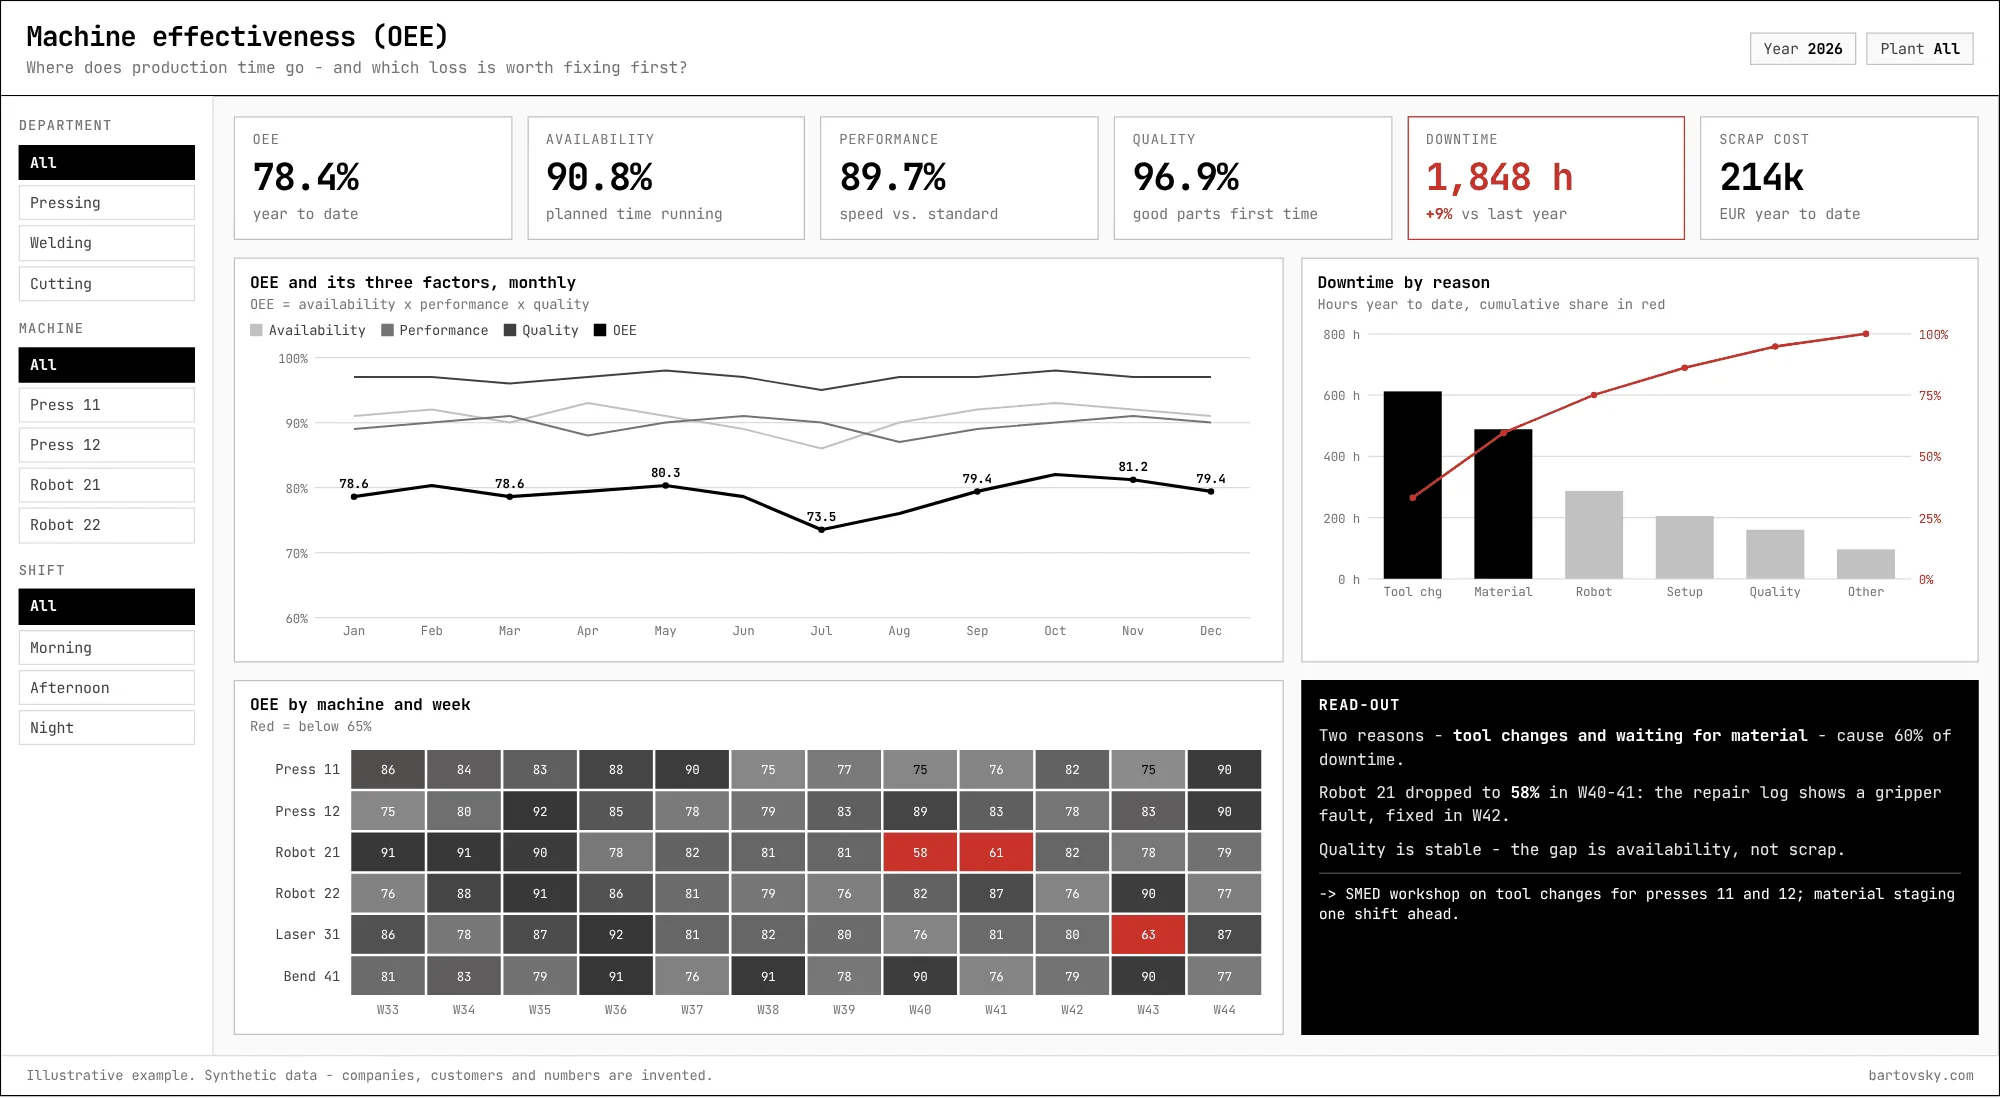
- OEE alone is a grade. Split into availability, performance and quality it says which kind of loss to chase.
- The Pareto puts two causes above the rest; the heat map shows the one machine and the two weeks that pulled the average down.
What it takes
The visuals are the quick part. Most of the work is under them: a semantic model built on the dimensions the business decides by, snapshots that keep history the ERP doesn’t, and capture rules that make the numbers worth reading in the first place. If you have a report nobody acts on, send me a screenshot - that’s a good place to start.
[->] next step
Where do your numbers stop adding up?
Start with a short call. Bring one report nobody trusts - I'll trace it back to where the data gets captured.